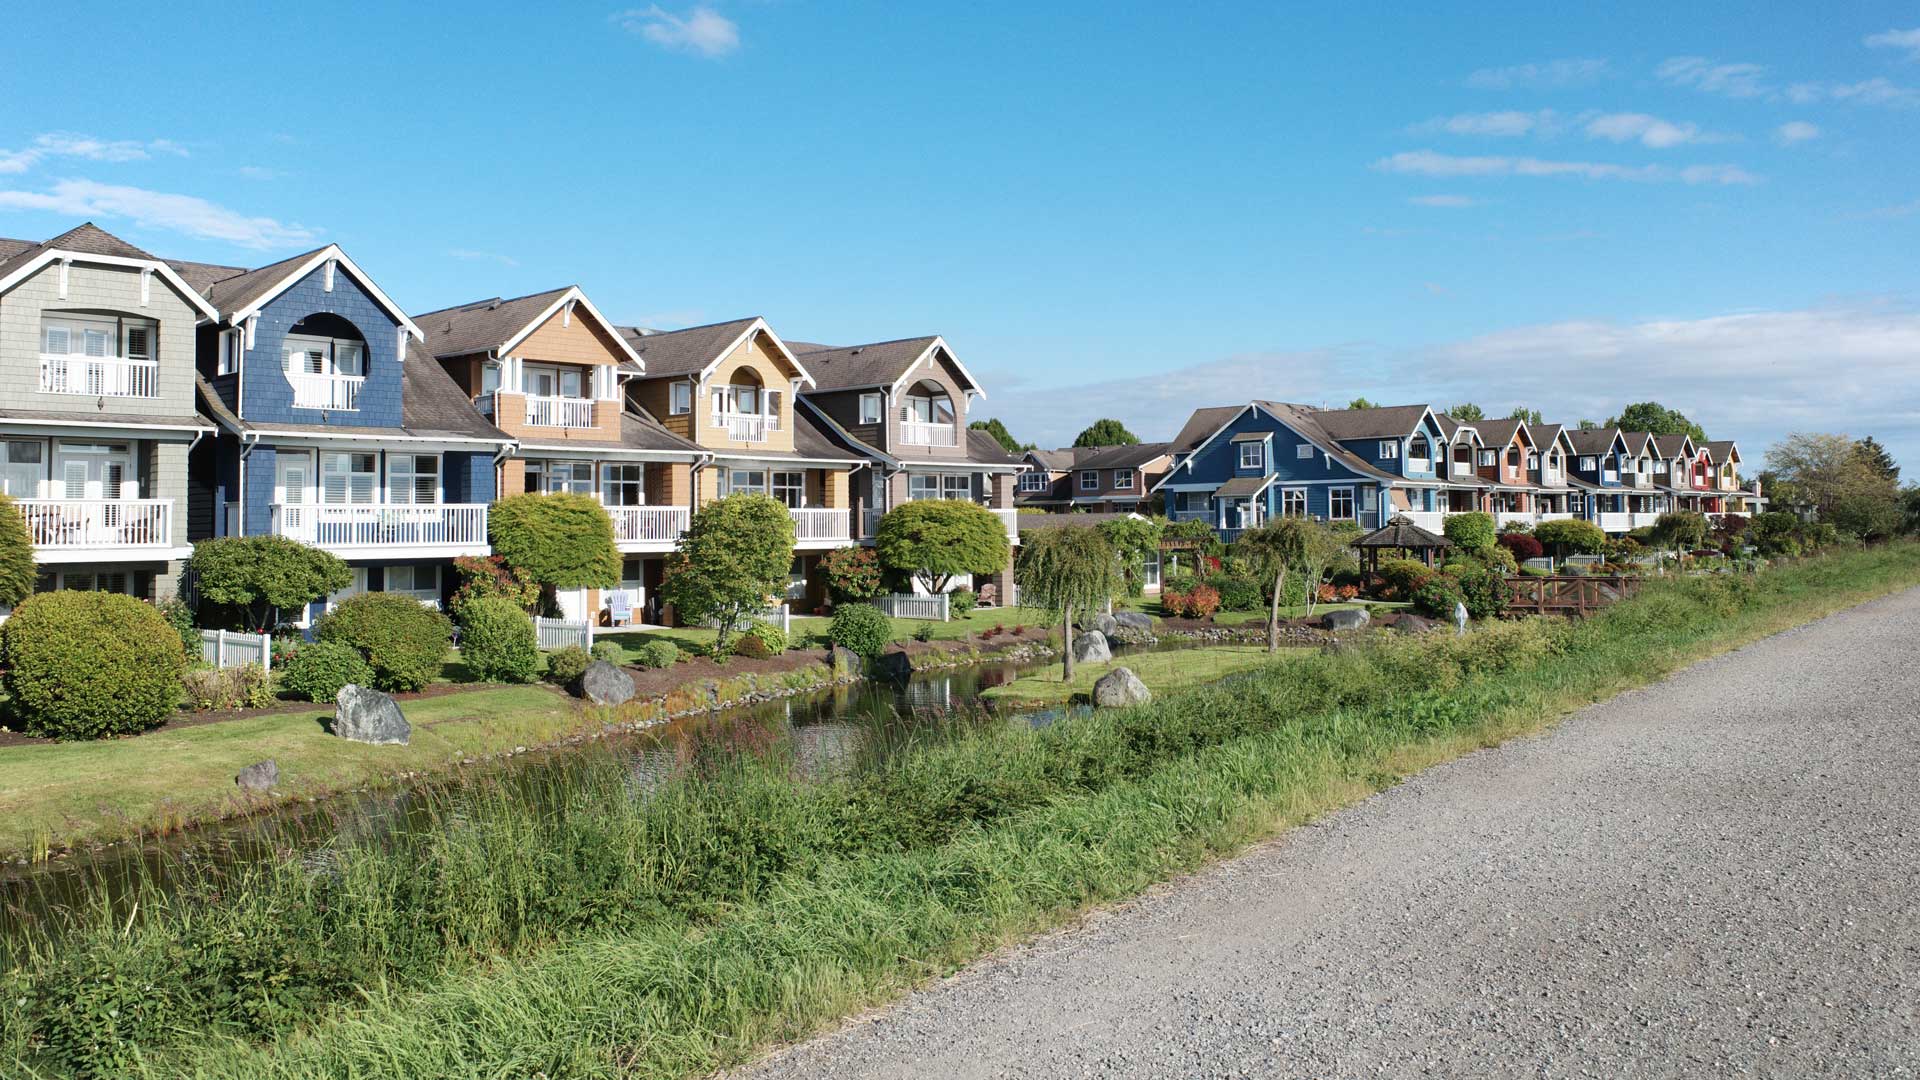
| 2019 | 2020 | 2021 | 2022 | 2023 (Q3) | |||||||||||
| Sales | $ Volume | % | Sales | $ Volume | % | Sales | $ Volume | % | Sales | $ Volume | % | Sales | $ Volume | % | |
| Burnaby | 18 | $ 364,258,949 | 26% | 7 | $ 60,804,750 | 8% | 21 | $ 318,048,000 | 0% | 16 | $ 172,784,249 | 0% | 6 | $ 117,723,300 | 15% |
| Coquitlam | 50 | $ 200,561,377 | 14% | 15 | $ 122,058,669 | 15% | 44 | $ 597,321,622 | 0% | 72 | $ 477,193,874 | 0% | 19 | $ 181,848,487 | 24% |
| New Westminster | 7 | $ 18,817,009 | 1% | 3 | $ 5,611,000 | 1% | 8 | $ 25,239,232 | 0% | 9 | $ 51,131,500 | 0% | 3 | $ 3,667,500 | 0% |
| North Vancouver | 18 | $ 119,531,000 | 9% | 10 | $ 74,197,000 | 9% | 25 | $ 199,119,177 | 0% | 12 | $ 45,581,500 | 0% | 5 | $ 11,023,000 | 1% |
| Port Coquitlam | 8 | $ 12,008,010 | 1% | 8 | $ 11,516,000 | 1% | 23 | $ 67,440,000 | 0% | 11 | $ 56,722,749 | 0% | 4 | $ 17,658,000 | 2% |
| Port Moody | 5 | $ 39,970,001 | 3% | 7 | $ 42,150,000 | 5% | 2 | $ 11,175,000 | 0% | 13 | $ 186,761,868 | 0% | 5 | $ 17,880,000 | 2% |
| Richmond | 16 | $ 76,701,790 | 6% | 9 | $ 96,488,808 | 12% | 25 | $ 424,419,865 | 0% | 39 | $ 174,765,992 | 0% | 13 | $ 60,571,580 | 8% |
| Vancouver | 68 | $ 538,236,260 | 39% | 49 | $ 369,143,750 | 47% | 98 | $ 821,058,371 | 0% | 100 | $ 833,248,576 | 0% | 38 | $ 349,855,887 | 46% |
| West Vancouver | 2 | $ 17,375,000 | 1% | 1 | $ 6,000,000 | 1% | 1 | $ 5,875,000 | 0% | 2 | $ 29,367,943 | 0% | 0 | $ 0 | 0% |
| Grand Total | 192 | $ 1,387,459,396 | 0% | 109 | $ 787,969,977 | 0% | 247 | $ 2,469,696,267 | 0% | 274 | $ 2,027,558,250 | 0% | 93 | $ 760,227,754 | 0% |
| 2019 | ||||
| Burnaby | 18 | $ 364,258,949 | 26% | |
| Coquitlam | 50 | $ 200,561,377 | 14% | |
| New Westminster | 7 | $ 18,817,009 | 1% | |
| North Vancouver | 18 | $ 119,531,000 | 9% | |
| Port Coquitlam | 8 | $ 12,008,010 | 1% | |
| Port Moody | 5 | $ 39,970,001 | 3% | |
| Richmond | 16 | $ 76,701,790 | 6% | |
| Vancouver | 68 | $ 538,236,260 | 39% | |
| West Vancouver | 2 | $ 17,375,000 | 1% | |
| Grand Total | 192 | $ 1,387,459,396 | 0% | |
| 2020 | ||||
| Burnaby | 7 | $ 60,804,750 | 8% | |
| Coquitlam | 15 | $ 122,058,669 | 15% | |
| New Westminster | 3 | $ 5,611,000 | 1% | |
| North Vancouver | 10 | $ 74,197,000 | 9% | |
| Port Coquitlam | 8 | $ 11,516,000 | 1% | |
| Port Moody | 7 | $ 42,150,000 | 5% | |
| Richmond | 9 | $ 96,488,808 | 12% | |
| Vancouver | 49 | $ 369,143,750 | 47% | |
| West Vancouver | 1 | $ 6,000,000 | 1% | |
| Grand Total | 109 | $ 787,969,977 | 0% | |
| 2021 | ||||
| Burnaby | 21 | $ 318,048,000 | 0% | |
| Coquitlam | 44 | $ 597,321,622 | 0% | |
| New Westminster | 8 | $ 25,239,232 | 0% | |
| North Vancouver | 25 | $ 199,119,177 | 0% | |
| Port Coquitlam | 23 | $ 67,440,000 | 0% | |
| Port Moody | 2 | $ 11,175,000 | 0% | |
| Richmond | 25 | $ 424,419,865 | 0% | |
| Vancouver | 98 | $ 821,058,371 | 0% | |
| West Vancouver | 1 | $ 5,875,000 | 0% | |
| Grand Total | 247 | $ 2,469,696,267 | 0% | |
| 2022 | ||||
| Burnaby | 16 | $ 172,784,249 | 0% | |
| Coquitlam | 72 | $ 477,193,874 | 0% | |
| New Westminster | 9 | $ 51,131,500 | 0% | |
| North Vancouver | 12 | $ 45,581,500 | 0% | |
| Port Coquitlam | 11 | $ 56,722,749 | 0% | |
| Port Moody | 13 | $ 186,761,868 | 0% | |
| Richmond | 39 | $ 174,765,992 | 0% | |
| Vancouver | 100 | $ 833,248,576 | 0% | |
| West Vancouver | 2 | $ 29,367,943 | 0% | |
| Grand Total | 274 | $ 2,027,558,250 | 0% | |
| 2023 (Q3) | ||||
| Burnaby | 6 | $ 117,723,300 | 15% | |
| Coquitlam | 19 | $ 181,848,487 | 24% | |
| New Westminster | 3 | $ 3,667,500 | 0% | |
| North Vancouver | 5 | $ 11,023,000 | 1% | |
| Port Coquitlam | 4 | $ 17,658,000 | 2% | |
| Port Moody | 5 | $ 17,880,000 | 2% | |
| Richmond | 13 | $ 60,571,580 | 8% | |
| Vancouver | 38 | $ 349,855,887 | 46% | |
| West Vancouver | 0 | $ 0 | 0% | |
| Grand Total | 93 | $ 760,227,754 | 0% | |
| Date | $ Volume | Transactions |
| 2019 | ||
| Qtr1 | 299048857 | 55 |
| Qtr2 | 347856760 | 52 |
| Qtr3 | 272370820 | 45 |
| Qtr4 | 468182959.3 | 40 |
| 2020 | ||
| Qtr1 | 186159750 | 29 |
| Qtr2 | 170317714.6 | 33 |
| Qtr3 | 211051808 | 24 |
| Qtr4 | 220440704.05 | 23 |
| 2021 | ||
| Qtr1 | 101780775.99 | 20 |
| Qtr2 | 436897581 | 66 |
| Qtr3 | 484672098.6 | 76 |
| Qtr4 | 1446345811.06 | 85 |
| 2022 | ||
| Qtr1 | 682403051 | 100 |
| Qtr2 | 575950272.5 | 71 |
| Qtr3 | 989239142.6 | 145 |
| Qtr4 | 766199974 | 83 |
| 2023 | ||
| Qtr1 | 298766080 | 26 |
| Qtr2 | 539964126 | 91 |
| Qtr3 | 232737250 | 42 |
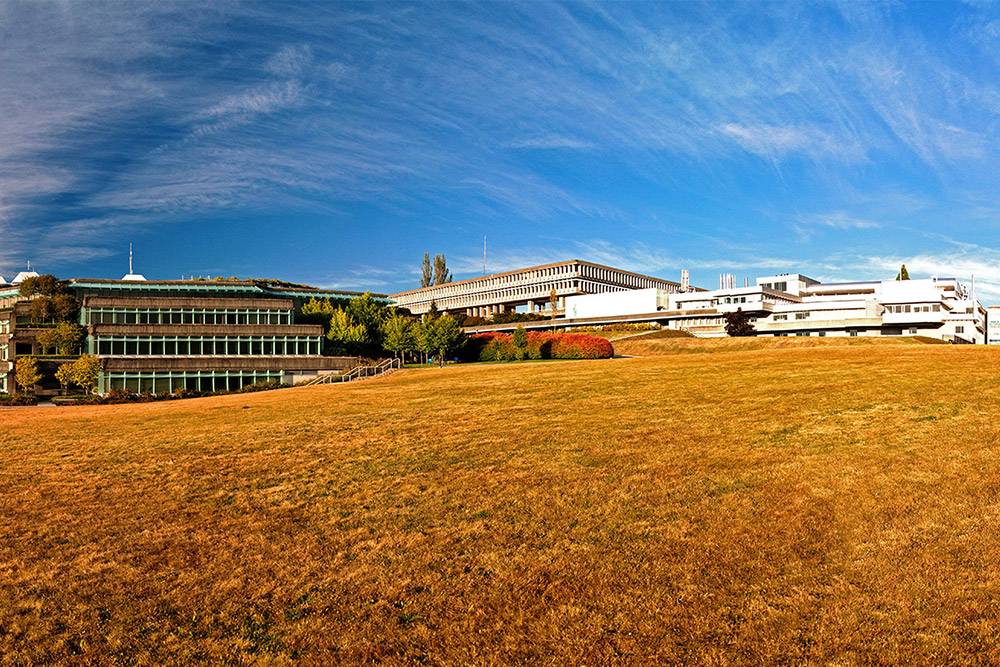
| Transaction Name | Price | Size (Acre) | Price/Acre |
| 4450 Juneau Street | $ 5,700,000 | 0.234 | - |
| Row Labels | Dollar Volume | Transactions |
| 2019 | 0 | 0 |
| Qtr1 | 80935000 | 4 |
| Qtr2 | 22373000 | 6 |
| Qtr3 | 57612000 | 5 |
| Qtr4 | 203338949 | 3 |
| 2020 | 0 | 0 |
| Qtr1 | 3004750 | 2 |
| Qtr2 | 0 | 0 |
| Qtr3 | 0 | 0 |
| Qtr4 | 0 | 0 |
| 2021 | 0 | 0 |
| Qtr1 | 0 | 0 |
| Qtr2 | 27288000 | 6 |
| Qtr3 | 19188000 | 7 |
| Qtr4 | 814716000 | 24 |
| 2022 | 0 | 0 |
| Qtr1 | 88968498 | 10 |
| Qtr2 | 73350000 | 6 |
| Qtr3 | 13500000 | 1 |
| Qtr4 | 41450000 | 4 |
| 2023 | 0 | 0 |
| Qtr1 | 108470000 | 4 |
| Qtr2 | 7106600.06 | 2 |
| Qtr3 | 5700000 | 1 |
| Grand Total | 0 | 0 |
| Row Labels | Price/Acre - High Density | Price/Acre - Medium Density | Land Size (Acre) - High Density | Land Size (Acre) - Medium Density | Total Price/Acre | Total Land Size (Acre) |
| 2019 | 0 | 0 | 0 | 0 | 0 | 0 |
| Qtr1 | 35843660.629171 | 0 | 0.8965 | 0.149 | 35843660.629171 | 0.64733333333333 |
| Qtr2 | 0 | 0 | 0.241 | 0.25275 | 0 | 0.24883333333333 |
| Qtr3 | 14568158.168574 | 0 | 0.898 | 0.114 | 14568158.168574 | 0.7412 |
| Qtr4 | 34889275 | 0 | 1.974 | 0 | 34889275 | 1.974 |
| 2020 | 0 | 0 | 0 | 0 | 0 | 0 |
| Qtr1 | 0 | 0 | 0 | 0.1465 | 0 | 0.1465 |
| Qtr2 | 0 | 0 | 0 | 0 | 0 | 0 |
| Qtr3 | 0 | 0 | 0 | 0 | 0 | 0 |
| Qtr4 | 0 | 0 | 0 | 0 | 0 | 0 |
| 2021 | 0 | 0 | 0 | 0 | 0 | 0 |
| Qtr1 | 0 | 0 | 0 | 0 | 0 | 0 |
| Qtr2 | 0 | 0 | 0.3459999859333 | 0.44100000460943 | 0 | 0.4172499999404 |
| Qtr3 | 0 | 0 | 0.39800000190735 | 0.24399999777476 | 0 | 0.26599999836513 |
| Qtr4 | 0 | 12833333 | 10.21649980545 | 0.63559998571873 | 12833333 | 3.3729999342135 |
| 2022 | 0 | 0 | 0 | 0 | 0 | 0 |
| Qtr1 | 0 | 0 | 0.42600000649691 | 0.29033332814773 | 0 | 0.3445999994874 |
| Qtr2 | 0 | 0 | 0.62825000286102 | 0.3285000026226 | 0 | 0.52833333611488 |
| Qtr3 | 0 | 0 | 0.55000001192093 | 0 | 0 | 0.55000001192093 |
| Qtr4 | 0 | 0 | 0.39066667358081 | 0.16500000655651 | 0 | 0.33425000682473 |
| 2023 | 0 | 0 | 0 | 0 | 0 | 0 |
| Qtr1 | 0 | 8861480 | 4.2849998474121 | 0.47666667153438 | 8861480 | 1.4287499655038 |
| Qtr2 | 0 | 0 | 0.082999996840954 | 0 | 0 | 0.082999996840954 |
| Qtr3 | 0 | 0 | 0.2339999973774 | 0 | 0 | 0.2339999973774 |
| Grand Total | 0 | 0 | 0 | 0 | 0 | 0 |

| Transaction Name | Price | Size (Acre) | Price/Acre |
| 1296 - 1298 Johnson Street | $ 6,911,250 | 1.2549999952316 | - |
| 1166 Charland Avenue | $ 1,800,000 | 0.20299999415874 | - |
| 266 Blue Mountain Street | $ 1,645,700 | 0.18099999427795 | - |
| Row Labels | Dollar Volume | Transactions |
| 2019 | 0 | 0 |
| Qtr1 | 47686556 | 15 |
| Qtr2 | 74088000 | 8 |
| Qtr3 | 53189820 | 17 |
| Qtr4 | 25597000 | 10 |
| 2020 | 0 | 0 |
| Qtr1 | 9045000 | 4 |
| Qtr2 | 23405000 | 4 |
| Qtr3 | 22600000 | 2 |
| Qtr4 | 27393104.05 | 4 |
| 2021 | 0 | 0 |
| Qtr1 | 23079999.99 | 4 |
| Qtr2 | 80980460 | 8 |
| Qtr3 | 82909827.66 | 13 |
| Qtr4 | 410351334.01 | 19 |
| 2022 | 0 | 0 |
| Qtr1 | 150411839 | 22 |
| Qtr2 | 99646576.5 | 10 |
| Qtr3 | 129915520 | 22 |
| Qtr4 | 97219938 | 18 |
| 2023 | 0 | 0 |
| Qtr1 | 0 | 0 |
| Qtr2 | 0 | 0 |
| Qtr3 | 0 | 0 |
| Grand Total | 0 | 0 |
| Row Labels | Price/Acre - High Density | Price/Acre - Medium Density | Land Size (Acre) - High Density | Land Size (Acre) - Medium Density | Total Price/Acre | Total Land Size (Acre) |
| 2019 | 0 | 0 | 0 | 0 | 0 | 0 |
| Qtr1 | 0 | 2607197.4874845 | 0.496 | 12.033 | 2607197.4874845 | 12.529 |
| Qtr2 | 0 | 8211647.9745714 | 0.137 | 12.156 | 8211647.9745714 | 12.293 |
| Qtr3 | 0 | 2267584.3180911 | 1.715 | 7.581 | 2267584.3180911 | 9.296 |
| Qtr4 | 0 | 0 | 1.59 | 0.982 | 0 | 2.572 |
| 2020 | 0 | 0 | 0 | 0 | 0 | 0 |
| Qtr1 | 0 | 0 | 0.305 | 0.327 | 0 | 0.632 |
| Qtr2 | 0 | 1555209.9533437 | 0.7 | 3.858 | 1555209.9533437 | 4.558 |
| Qtr3 | 0 | 0 | 0 | 0.21999999880791 | 0 | 0.21999999880791 |
| Qtr4 | 0 | 0 | 0 | 1.9780000001192 | 0 | 1.9780000001192 |
| 2021 | 0 | 0 | 0 | 0 | 0 | 0 |
| Qtr1 | 0 | 0 | 0.351 | 1.862 | 0 | 2.213 |
| Qtr2 | 0 | 0 | 2.0909999459982 | 3.7619998753071 | 0 | 5.8529998213053 |
| Qtr3 | 0 | 1081139 | 3.9270000010729 | 4.4080001041293 | 1081139 | 8.3350001052022 |
| Qtr4 | 0 | 5250000 | 17.950000092387 | 4.1470000334084 | 5250000 | 22.097000125796 |
| 2022 | 0 | 0 | 0 | 0 | 0 | 0 |
| Qtr1 | 0 | 9931360 | 1.4139999747276 | 15.116000026464 | 9931360 | 16.530000001192 |
| Qtr2 | 0 | 9912275.75 | 2.527999997139 | 7.7870000451803 | 9912275.75 | 10.315000042319 |
| Qtr3 | 20384950 | 0 | 5.1400000378489 | 3.8930000513792 | 20384950 | 9.0330000892282 |
| Qtr4 | 0 | 20402299 | 2.4800000265241 | 9.1210000142455 | 20402299 | 11.60100004077 |
| 2023 | 0 | 0 | 0 | 0 | 0 | 0 |
| Qtr1 | 0 | 824000 | 0 | 5.3739999979734 | 824000 | 5.3739999979734 |
| Qtr2 | 0 | 2733789 | 8.6710003912449 | 10.370999731123 | 2733789 | 19.042000122368 |
| Qtr3 | 0 | 0 | 0 | 1.4579999893904 | 0 | 1.4579999893904 |
| Grand Total | 0 | 0 | 0 | 0 | 0 | 0 |
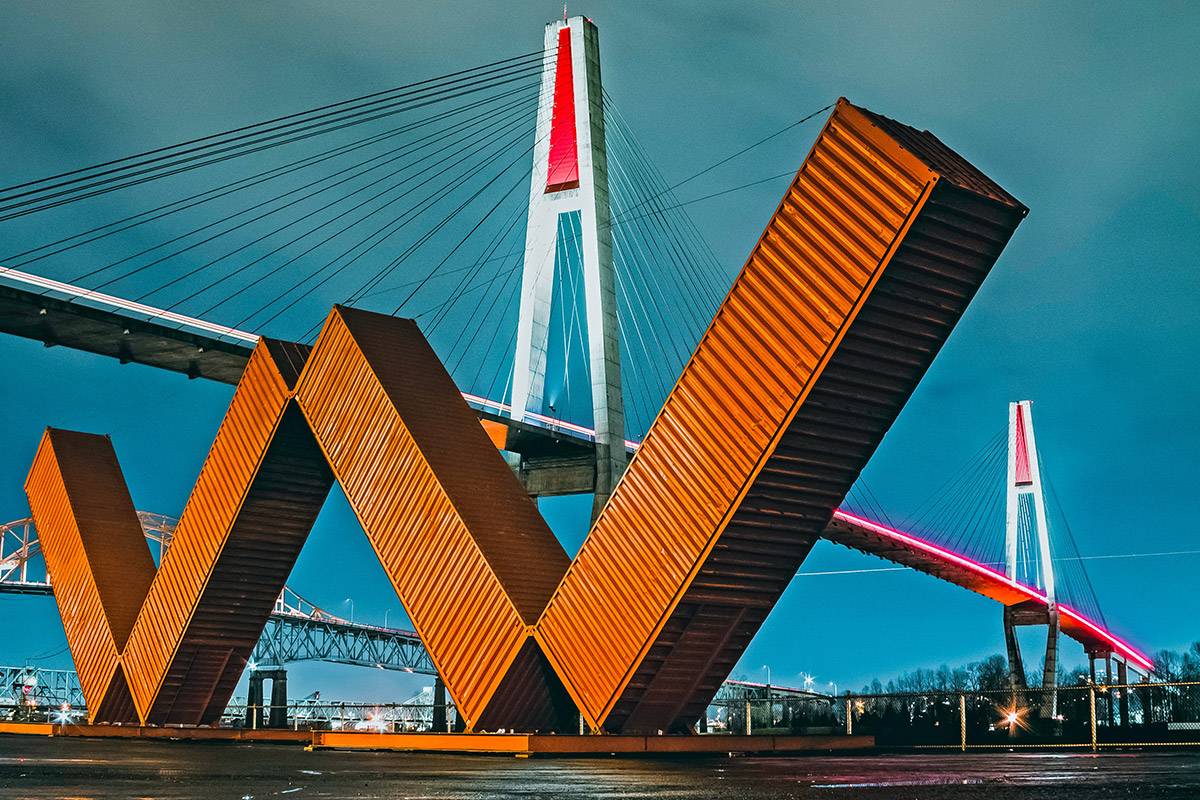
| Transaction Name | Price | Size (Acre) | Price/Acre |
| 310 Blackley Street | $ 870,000 | 0.127 | - |
| Row Labels | Dollar Volume | Transactions |
| 2019 | 0 | 0 |
| Qtr1 | 4485000 | 2 |
| Qtr2 | 0 | 0 |
| Qtr3 | 4100000 | 1 |
| Qtr4 | 10232009.3 | 4 |
| 2020 | 0 | 0 |
| Qtr1 | 1186000 | 1 |
| Qtr2 | 2350000 | 1 |
| Qtr3 | 0 | 0 |
| Qtr4 | 2075000 | 1 |
| 2021 | 0 | 0 |
| Qtr1 | 7045000 | 2 |
| Qtr2 | 8434000 | 6 |
| Qtr3 | 13977232 | 3 |
| Qtr4 | 0 | 0 |
| 2022 | 0 | 0 |
| Qtr1 | 39352500 | 6 |
| Qtr2 | 0 | 0 |
| Qtr3 | 0 | 0 |
| Qtr4 | 0 | 0 |
| 2023 | 0 | 0 |
| Qtr1 | 0 | 0 |
| Qtr2 | 1215000 | 1 |
| Qtr3 | 870000 | 1 |
| Grand Total | 0 | 0 |
| Row Labels | Price/Acre - High Density | Price/Acre - Medium Density | Land Size (Acre) - High Density | Land Size (Acre) - Medium Density | Total Price/Acre | Total Land Size (Acre) |
| 2019 | 0 | 0 | 0 | 0 | 0 | 0 |
| Qtr1 | 0 | 12505839.416058 | 0 | 0.337 | 12505839.416058 | 0.337 |
| Qtr2 | 0 | 0 | 0 | 0 | 0 | 0 |
| Qtr3 | 20500000 | 0 | 0.2 | 0 | 20500000 | 0.2 |
| Qtr4 | 17765957.446809 | 6721859.3425318 | 0.329 | 1.279 | 9482883.868601 | 1.608 |
| 2020 | 0 | 0 | 0 | 0 | 0 | 0 |
| Qtr1 | 0 | 5930000 | 0 | 0.2 | 5930000 | 0.2 |
| Qtr2 | 0 | 0 | 0.10300000011921 | 0 | 0 | 0.10300000011921 |
| Qtr3 | 0 | 0 | 0 | 0 | 0 | 0 |
| Qtr4 | 0 | 0 | 0 | 0.5 | 0 | 0.5 |
| 2021 | 0 | 0 | 0 | 0 | 0 | 0 |
| Qtr1 | 0 | 0 | 0.172 | 0.138 | 0 | 0.31 |
| Qtr2 | 0 | 0 | 0 | 0.27599999654293 | 0 | 0.27599999654293 |
| Qtr3 | 0 | 0 | 0 | 1.2840000241995 | 0 | 1.2840000241995 |
| Qtr4 | 0 | 0 | 0 | 0 | 0 | 0 |
| 2022 | 0 | 0 | 0 | 0 | 0 | 0 |
| Qtr1 | 0 | 0 | 0.79900002479553 | 1.8950000107288 | 0 | 2.6940000355244 |
| Qtr2 | 0 | 0 | 0 | 0 | 0 | 0 |
| Qtr3 | 0 | 0 | 0 | 0 | 0 | 0 |
| Qtr4 | 0 | 0 | 0 | 0 | 0 | 0 |
| 2023 | 0 | 0 | 0 | 0 | 0 | 0 |
| Qtr1 | 0 | 0 | 0 | 0 | 0 | 0 |
| Qtr2 | 0 | 0 | 0 | 0 | 0 | 0 |
| Qtr3 | 0 | 0 | 0 | 0.12700000405312 | 0 | 0.12700000405312 |
| Grand Total | 0 | 0 | 0 | 0 | 0 | 0 |
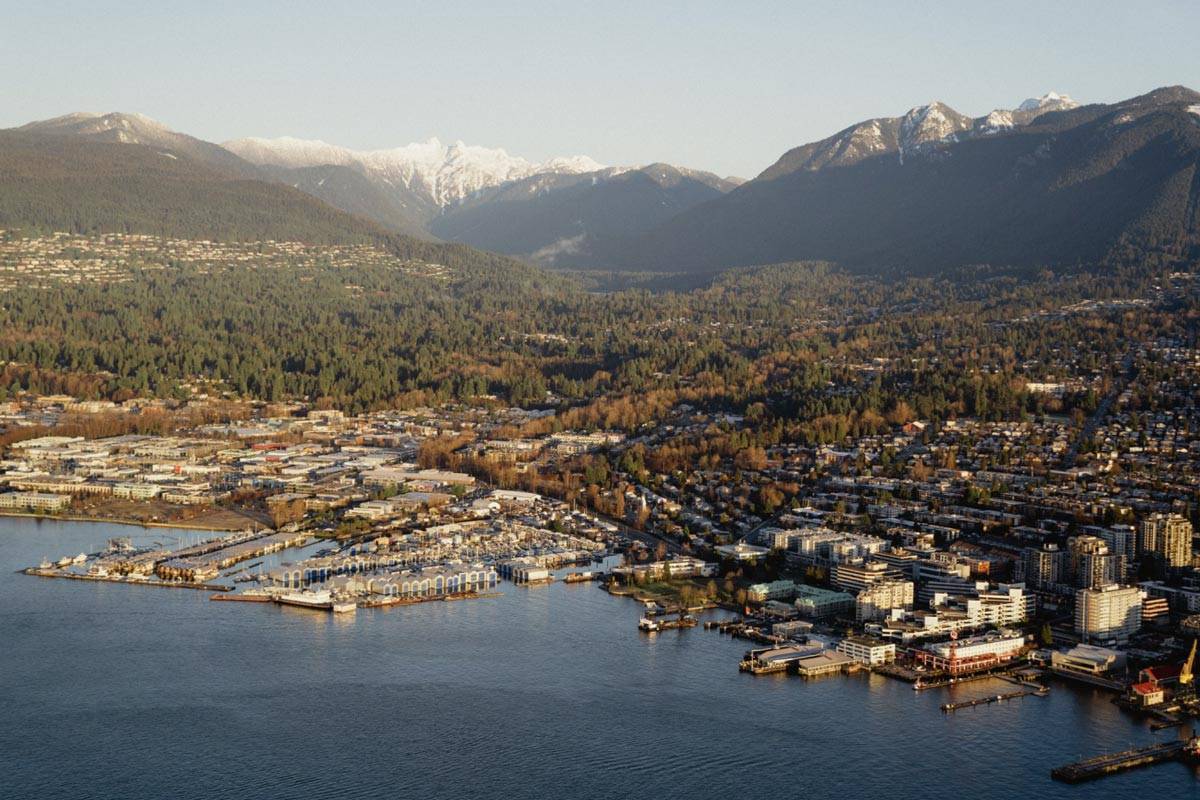
| Transaction Name | Price | Size (Acre) | Price/Acre |
| 322 East 18th Street | $ 2,180,000 | 0.169 | - |
| 318 East 17th Street | $ 2,130,000 | 0.169 | - |
| Row Labels | Dollar Volume | Transactions |
| 2019 | 0 | 0 |
| Qtr1 | 16645000 | 4 |
| Qtr2 | 32936000 | 7 |
| Qtr3 | 66850000 | 5 |
| Qtr4 | 3100000 | 2 |
| 2020 | 0 | 0 |
| Qtr1 | 10070000 | 3 |
| Qtr2 | 5752000 | 2 |
| Qtr3 | 2925000 | 1 |
| Qtr4 | 37950000 | 3 |
| 2021 | 0 | 0 |
| Qtr1 | 10890000 | 2 |
| Qtr2 | 75086888 | 8 |
| Qtr3 | 36747038.94 | 8 |
| Qtr4 | 76395250 | 7 |
| 2022 | 0 | 0 |
| Qtr1 | 8110000 | 3 |
| Qtr2 | 20200000 | 4 |
| Qtr3 | 11146500 | 3 |
| Qtr4 | 6125000 | 2 |
| 2023 | 0 | 0 |
| Qtr1 | 2900000 | 1 |
| Qtr2 | 3813000 | 2 |
| Qtr3 | 4310000 | 2 |
| Grand Total | 0 | 0 |
| Row Labels | Price/Acre - High Density | Price/Acre - Medium Density | Land Size (Acre) - High Density | Land Size (Acre) - Medium Density | Total Price/Acre | Total Land Size (Acre) |
| 2019 | 0 | 0 | 0 | 0 | 0 | 0 |
| Qtr1 | 23629856.850716 | 18831586.146164 | 0.489 | 0.268 | 20031153.822302 | 0.757 |
| Qtr2 | 23582474.226804 | 14553519.668737 | 0.388 | 1.372 | 16058345.428415 | 1.76 |
| Qtr3 | 0 | 16854293.281475 | 0 | 3.974 | 16854293.281475 | 3.974 |
| Qtr4 | 0 | 15760869.565217 | 0 | 0.138 | 15760869.565217 | 0.138 |
| 2020 | 0 | 0 | 0 | 0 | 0 | 0 |
| Qtr1 | 0 | 0 | 0 | 0.592 | 0 | 0.592 |
| Qtr2 | 0 | 0 | 0 | 0.387 | 0 | 0.387 |
| Qtr3 | 0 | 0 | 0 | 0.13799999654293 | 0 | 0.13799999654293 |
| Qtr4 | 0 | 0 | 0.96999999880791 | 0.15600000321865 | 0 | 1.1260000020266 |
| 2021 | 0 | 0 | 0 | 0 | 0 | 0 |
| Qtr1 | 0 | 0 | 0.397 | 0.092 | 0 | 0.489 |
| Qtr2 | 0 | 18356486 | 1.2920000106096 | 2.2580000013113 | 18356486 | 3.5500000119209 |
| Qtr3 | 0 | 0 | 0.52300000190735 | 1.3839999884367 | 0 | 1.906999990344 |
| Qtr4 | 0 | 16664193 | 0.36000001430511 | 3.5510000437498 | 16664193 | 3.9110000580549 |
| 2022 | 0 | 0 | 0 | 0 | 0 | 0 |
| Qtr1 | 0 | 0 | 0 | 0.40399999171495 | 0 | 0.40399999171495 |
| Qtr2 | 0 | 0 | 0.27599999308586 | 0.83600001037121 | 0 | 1.1120000034571 |
| Qtr3 | 0 | 0 | 0 | 0.29500000178814 | 0 | 0.29500000178814 |
| Qtr4 | 0 | 0 | 0.18899999558926 | 0 | 0 | 0.18899999558926 |
| 2023 | 0 | 0 | 0 | 0 | 0 | 0 |
| Qtr1 | 0 | 0 | 0 | 0.20999999344349 | 0 | 0.20999999344349 |
| Qtr2 | 0 | 0 | 0 | 0.25200000405312 | 0 | 0.25200000405312 |
| Qtr3 | 0 | 0 | 0 | 0 | 0 | 0 |
| Grand Total | 0 | 0 | 0 | 0 | 0 | 0 |

| Transaction Name | Price | Size (Acre) | Price/Acre |
| 1727 Prairie Avenue | $ 3,098,000 | 0.30099999904633 | - |
| 2385 Mary Hill Road | $ 1,420,000 | 0.083999998867512 | - |
| Row Labels | Dollar Volume | Transactions |
| 2019 | 0 | 0 |
| Qtr1 | 4250010 | 3 |
| Qtr2 | 6198000 | 3 |
| Qtr3 | 760000 | 1 |
| Qtr4 | 800000 | 1 |
| 2020 | 0 | 0 |
| Qtr1 | 1591000 | 2 |
| Qtr2 | 4420000 | 2 |
| Qtr3 | 0 | 0 |
| Qtr4 | 5505000 | 4 |
| 2021 | 0 | 0 |
| Qtr1 | 32218000 | 8 |
| Qtr2 | 22550000 | 9 |
| Qtr3 | 9002000 | 4 |
| Qtr4 | 3670000 | 2 |
| 2022 | 0 | 0 |
| Qtr1 | 29664999 | 7 |
| Qtr2 | 2080000 | 1 |
| Qtr3 | 8950000 | 2 |
| Qtr4 | 16027750 | 1 |
| 2023 | 0 | 0 |
| Qtr1 | 0 | 0 |
| Qtr2 | 13140000 | 2 |
| Qtr3 | 4518000 | 2 |
| Grand Total | 0 | 0 |
| Row Labels | Price/Acre - High Density | Price/Acre - Medium Density | Land Size (Acre) - High Density | Land Size (Acre) - Medium Density | Total Price/Acre | Total Land Size (Acre) |
| 2019 | 0 | 0 | 0 | 0 | 0 | 0 |
| Qtr1 | 0 | 0 | 0 | 0.627 | 0 | 0.627 |
| Qtr2 | 0 | 0 | 0 | 0.876 | 0 | 0.876 |
| Qtr3 | 0 | 0 | 0 | 0.114 | 0 | 0.114 |
| Qtr4 | 0 | 0 | 0 | 0.185 | 0 | 0.185 |
| 2020 | 0 | 0 | 0 | 0 | 0 | 0 |
| Qtr1 | 0 | 0 | 0 | 0.291 | 0 | 0.291 |
| Qtr2 | 0 | 0 | 0 | 0.471 | 0 | 0.471 |
| Qtr3 | 0 | 0 | 0 | 0 | 0 | 0 |
| Qtr4 | 0 | 0 | 0 | 0.96499998867512 | 0 | 0.96499998867512 |
| 2021 | 0 | 0 | 0 | 0 | 0 | 0 |
| Qtr1 | 0 | 0 | 2.366 | 1.269 | 0 | 3.635 |
| Qtr2 | 0 | 0 | 0.38800001144409 | 2.0969999954104 | 0 | 2.4850000068545 |
| Qtr3 | 0 | 0 | 0.1710000038147 | 0.84600001573563 | 0 | 1.0170000195503 |
| Qtr4 | 0 | 0 | 0.1710000038147 | 0.195999994874 | 0 | 0.3669999986887 |
| 2022 | 0 | 0 | 0 | 0 | 0 | 0 |
| Qtr1 | 0 | 0 | 1.6209999769926 | 0.53899998962879 | 0 | 2.1599999666214 |
| Qtr2 | 0 | 0 | 0.1710000038147 | 0 | 0 | 0.1710000038147 |
| Qtr3 | 0 | 0 | 0.39899998903275 | 0.18500000238419 | 0 | 0.58399999141693 |
| Qtr4 | 0 | 11456576 | 0 | 1.3990000486374 | 11456576 | 1.3990000486374 |
| 2023 | 0 | 0 | 0 | 0 | 0 | 0 |
| Qtr1 | 0 | 0 | 0 | 0 | 0 | 0 |
| Qtr2 | 0 | 4144366.2 | 0.19099999964237 | 2.8399999141693 | 4144366.2 | 3.0309999138117 |
| Qtr3 | 0 | 0 | 0.083999998867512 | 0.30099999904633 | 0 | 0.38499999791384 |
| Grand Total | 0 | 0 | 0 | 0 | 0 | 0 |
| Transaction Name | Price | Size (Acre) | Price/Acre |
| 2818 St. George Street | $ 2,350,000 | 0.20600000023842 | - |
| 2201 Clarke Street & 84 Douglas Street | $ 2,130,000 | 0.20000000298023 | - |
| Row Labels | Dollar Volume | Transactions |
| 2019 | 0 | 0 |
| Qtr1 | 1 | 1 |
| Qtr2 | 34350000 | 2 |
| Qtr3 | 1420000 | 1 |
| Qtr4 | 4200000 | 1 |
| 2020 | 0 | 0 |
| Qtr1 | 5200000 | 2 |
| Qtr2 | 0 | 0 |
| Qtr3 | 21350000 | 3 |
| Qtr4 | 0 | 0 |
| 2021 | 0 | 0 |
| Qtr1 | 0 | 0 |
| Qtr2 | 11175000 | 2 |
| Qtr3 | 0 | 0 |
| Qtr4 | 1800000 | 1 |
| 2022 | 0 | 0 |
| Qtr1 | 0 | 1 |
| Qtr2 | 43790368 | 7 |
| Qtr3 | 137474500 | 4 |
| Qtr4 | 5497000 | 2 |
| 2023 | 0 | 0 |
| Qtr1 | 5600000 | 1 |
| Qtr2 | 7800000 | 2 |
| Qtr3 | 4480000 | 2 |
| Grand Total | 0 | 0 |
| Row Labels | Price/Acre - High Density | Price/Acre - Medium Density | Land Size (Acre) - High Density | Land Size (Acre) - Medium Density | Total Price/Acre | Total Land Size (Acre) |
| 2019 | 0 | 0 | 0 | 0 | 0 | 0 |
| Qtr1 | 0 | 0 | 0 | 0.2 | 0 | 0.2 |
| Qtr2 | 14217598.612917 | 0 | 2.307 | 0.215 | 14217598.612917 | 2.522 |
| Qtr3 | 0 | 0 | 0 | 0.209 | 0 | 0.209 |
| Qtr4 | 0 | 0 | 0 | 0.6 | 0 | 0.6 |
| 2020 | 0 | 0 | 0 | 0 | 0 | 0 |
| Qtr1 | 0 | 0 | 0.633 | 0 | 0 | 0.633 |
| Qtr2 | 0 | 0 | 0 | 0 | 0 | 0 |
| Qtr3 | 0 | 0 | 1.1749999821186 | 0.41200000047684 | 0 | 1.5869999825954 |
| Qtr4 | 0 | 0 | 0 | 0 | 0 | 0 |
| 2021 | 0 | 0 | 0 | 0 | 0 | 0 |
| Qtr1 | 0 | 0 | 0 | 0 | 0 | 0 |
| Qtr2 | 0 | 0 | 0 | 1.118 | 0 | 1.118 |
| Qtr3 | 0 | 0 | 0 | 0 | 0 | 0 |
| Qtr4 | 0 | 0 | 0.21500000357628 | 0 | 0 | 0.21500000357628 |
| 2022 | 0 | 0 | 0 | 0 | 0 | 0 |
| Qtr1 | 0 | 0 | 0 | 0 | 0 | 0 |
| Qtr2 | 0 | 10995025 | 0.92399999499321 | 2.2890000194311 | 10995025 | 3.2130000144243 |
| Qtr3 | 12855695.614887 | 0 | 10.364000335336 | 0 | 12855695.614887 | 10.364000335336 |
| Qtr4 | 0 | 0 | 0.42300000786781 | 0 | 0 | 0.42300000786781 |
| 2023 | 0 | 0 | 0 | 0 | 0 | 0 |
| Qtr1 | 0 | 0 | 0.40000000596046 | 0 | 0 | 0.40000000596046 |
| Qtr2 | 0 | 0 | 0 | 0.59900000691414 | 0 | 0.59900000691414 |
| Qtr3 | 0 | 0 | 0 | 0.40600000321865 | 0 | 0.40600000321865 |
| Grand Total | 0 | 0 | 0 | 0 | 0 | 0 |
| Transaction Name | Price | Size (Acre) | Price/Acre |
| 8131 & 8151 Bennett Road | $ 14,973,000 | 1.44 | $ 10,397,916 |
| 6800 No. 3 Road | $ 7,100,000 | 0.315 | - |
| 9240 Willaims Road | $ 1,625,000 | 0.185 | - |
| Row Labels | Dollar Volume | Transactions |
| 2019 | 0 | 0 |
| Qtr1 | 23043790 | 8 |
| Qtr2 | 21508000 | 5 |
| Qtr3 | 3500000 | 1 |
| Qtr4 | 28650000 | 2 |
| 2020 | 0 | 0 |
| Qtr1 | 66300000 | 3 |
| Qtr2 | 1210000 | 1 |
| Qtr3 | 18240808 | 2 |
| Qtr4 | 3400000 | 1 |
| 2021 | 0 | 0 |
| Qtr1 | 33550000 | 3 |
| Qtr2 | 71556000 | 10 |
| Qtr3 | 57640000 | 6 |
| Qtr4 | 301273865 | 8 |
| 2022 | 0 | 0 |
| Qtr1 | 85495186 | 18 |
| Qtr2 | 53873530 | 12 |
| Qtr3 | 26799276 | 7 |
| Qtr4 | 2280000 | 1 |
| 2023 | 0 | 0 |
| Qtr1 | 6518580 | 3 |
| Qtr2 | 30355000 | 7 |
| Qtr3 | 23698000 | 3 |
| Grand Total | 0 | 0 |
| Row Labels | Price/Acre - High Density | Price/Acre - Medium Density | Land Size (Acre) - High Density | Land Size (Acre) - Medium Density | Total Price/Acre | Total Land Size (Acre) |
| 2019 | 0 | 0 | 0 | 0 | 0 | 0 |
| Qtr1 | 0 | 0 | 0.293 | 2.415 | 0 | 2.708 |
| Qtr2 | 10184887.459807 | 0 | 1.244 | 1.257 | 10184887.459807 | 2.501 |
| Qtr3 | 0 | 0 | 0 | 0.23 | 0 | 0.23 |
| Qtr4 | 16881028.938907 | 0 | 1.244 | 0.544 | 16881028.938907 | 1.788 |
| 2020 | 0 | 0 | 0 | 0 | 0 | 0 |
| Qtr1 | 17462165.308498 | 0 | 3.729 | 0.4 | 17462165.308498 | 4.129 |
| Qtr2 | 0 | 0 | 0 | 0.22 | 0 | 0.22 |
| Qtr3 | 0 | 0 | 0 | 0.98699998855591 | 0 | 0.98699998855591 |
| Qtr4 | 0 | 0 | 0 | 0.36500000953674 | 0 | 0.36500000953674 |
| 2021 | 0 | 0 | 0 | 0 | 0 | 0 |
| Qtr1 | 0 | 0 | 1.923 | 1.78 | 0 | 3.703 |
| Qtr2 | 0 | 0 | 4.0110000371933 | 1.9630000144243 | 0 | 5.9740000516176 |
| Qtr3 | 0 | 6478455.5 | 1.0779999792576 | 4.9449999332428 | 6478455.5 | 6.0229999125004 |
| Qtr4 | 0 | 0 | 28.60000038147 | 1.7199999988079 | 0 | 30.320000380278 |
| 2022 | 0 | 0 | 0 | 0 | 0 | 0 |
| Qtr1 | 0 | 4905461 | 1.5 | 8.9529999494553 | 4905461 | 10.452999949455 |
| Qtr2 | 0 | 17431987 | 0 | 4.477000027895 | 17431987 | 4.477000027895 |
| Qtr3 | 0 | 0 | 0 | 2.2340000271797 | 0 | 2.2340000271797 |
| Qtr4 | 0 | 0 | 0 | 0.24600000679493 | 0 | 0.24600000679493 |
| 2023 | 0 | 0 | 0 | 0 | 0 | 0 |
| Qtr1 | 0 | 0 | 0 | 0.65800000727177 | 0 | 0.65800000727177 |
| Qtr2 | 0 | 0 | 1.410000026226 | 1.156999990344 | 0 | 2.5670000165701 |
| Qtr3 | 10397916 | 0 | 1.7550000548363 | 0.18500000238419 | 10397916 | 1.9400000572205 |
| Grand Total | 0 | 0 | 0 | 0 | 0 | 0 |
| Transaction Name | Price | Size (Acre) | Price/Acre |
| 1026 & 1068 - 1108 West 41st Avenue | $ 25,920,000 | 0.842 | $ 30,607,843 |
| 4910, 4930 & 4950 Willow Street | $ 16,671,000 | 0.498 | - |
| Bayswater Plaza | $ 11,800,000 | 0.254 | - |
| 2620 Trimble Street | $ 7,150,000 | 0.185 | - |
| 2760 West 4th Avenue | $ 5,225,000 | 0.13 | - |
| Row Labels | Dollar Volume | Transactions |
| 2019 | 0 | 0 |
| Qtr1 | 115628500 | 17 |
| Qtr2 | 156403760 | 21 |
| Qtr3 | 84939000 | 14 |
| Qtr4 | 181265000 | 16 |
| 2020 | 0 | 0 |
| Qtr1 | 89763000 | 12 |
| Qtr2 | 66727149.6 | 20 |
| Qtr3 | 65468000 | 6 |
| Qtr4 | 142277600 | 10 |
| 2021 | 0 | 0 |
| Qtr1 | 28547776 | 4 |
| Qtr2 | 144044233 | 20 |
| Qtr3 | 271258000 | 34 |
| Qtr4 | 377208361.05 | 39 |
| 2022 | 0 | 0 |
| Qtr1 | 324884278 | 39 |
| Qtr2 | 271230798 | 28 |
| Qtr3 | 139458000 | 18 |
| Qtr4 | 84865500 | 12 |
| 2023 | 0 | 0 |
| Qtr1 | 161210000 | 10 |
| Qtr2 | 106176887 | 18 |
| Qtr3 | 82469000 | 10 |
| Grand Total | 0 | 0 |
| Row Labels | Price/Acre - High Density | Price/Acre - Medium Density | Land Size (Acre) - High Density | Land Size (Acre) - Medium Density | Total Price/Acre | Total Land Size (Acre) |
| 2019 | 0 | 0 | 0 | 0 | 0 | 0 |
| Qtr1 | 0 | 0 | 0.827 | 3.234 | 0 | 4.061 |
| Qtr2 | 0 | 26807107.843137 | 0.382 | 4.702 | 26807107.843137 | 5.084 |
| Qtr3 | 0 | 0 | 0.292 | 2.38 | 0 | 2.672 |
| Qtr4 | 0 | 28668338.0446 | 1.131 | 5.725 | 28668338.0446 | 6.856 |
| 2020 | 0 | 0 | 0 | 0 | 0 | 0 |
| Qtr1 | 0 | 0 | 1.961 | 1.04 | 0 | 3.001 |
| Qtr2 | 0 | 0 | 1.4220000058413 | 1.4020000211895 | 0 | 2.8240000270307 |
| Qtr3 | 0 | 0 | 1.1010000258684 | 0.19200000166893 | 0 | 1.2930000275373 |
| Qtr4 | 0 | 0 | 2.2480000182986 | 1.6420000195503 | 0 | 3.8900000378489 |
| 2021 | 0 | 0 | 0 | 0 | 0 | 0 |
| Qtr1 | 0 | 0 | 0.567 | 0.33 | 0 | 0.897 |
| Qtr2 | 0 | 0 | 1.2760000191629 | 4.600000032723 | 0 | 5.8760000518858 |
| Qtr3 | 0 | 25264451.5 | 2.9560000672936 | 5.6960000097752 | 25264451.5 | 8.6520000770688 |
| Qtr4 | 0 | 23327531 | 3.3129999488592 | 6.7950000166893 | 23327531 | 10.107999965549 |
| 2022 | 0 | 0 | 0 | 0 | 0 | 0 |
| Qtr1 | 0 | 0 | 4.5529999732971 | 7.6950000226498 | 0 | 12.247999995947 |
| Qtr2 | 0 | 25589223 | 0.73499998450279 | 9.8810000866652 | 25589223 | 10.616000071168 |
| Qtr3 | 0 | 0 | 2.9839999526739 | 1.2960000112653 | 0 | 4.2799999639392 |
| Qtr4 | 0 | 0 | 0.56400001049042 | 2.5659999921918 | 0 | 3.1300000026822 |
| 2023 | 0 | 0 | 0 | 0 | 0 | 0 |
| Qtr1 | 48762887 | 0 | 2.1430000439286 | 0.58399999141693 | 48762887 | 2.7270000353456 |
| Qtr2 | 0 | 0 | 0.64200001209974 | 1.3980000242591 | 0 | 2.0400000363588 |
| Qtr3 | 0 | 0 | 0.74100000411272 | 0.67899999767542 | 0 | 1.4200000017881 |
| Grand Total | 0 | 0 | 0 | 0 | 0 | 0 |
| Transaction Name | Price | Size (Acre) | Price/Acre |
| No Transactions in Q3-2023 | - | - | - |
| Row Labels | Dollar Volume | Transactions |
| 2019 | 0 | 0 |
| Qtr1 | 0 | 0 |
| Qtr2 | 0 | 0 |
| Qtr3 | 0 | 0 |
| Qtr4 | 0 | 0 |
| 2020 | 0 | 0 |
| Qtr1 | 0 | 0 |
| Qtr2 | 0 | 0 |
| Qtr3 | 6000000 | 0 |
| Qtr4 | 0 | 0 |
| 2021 | 0 | 0 |
| Qtr1 | 0 | 0 |
| Qtr2 | 0 | 0 |
| Qtr3 | 0 | 0 |
| Qtr4 | 5875000 | 1 |
| 2022 | 0 | 0 |
| Qtr1 | 0 | 0 |
| Qtr2 | 0 | 0 |
| Qtr3 | 29367942.6 | 2 |
| Qtr4 | 0 | 0 |
| 2023 | 0 | 0 |
| Qtr1 | 0 | 0 |
| Qtr2 | 0 | 0 |
| Qtr3 | 0 | 0 |
| Grand Total | 0 | 0 |
| Row Labels | Price/Acre - High Density | Price/Acre - Medium Density | Land Size (Acre) - High Density | Land Size (Acre) - Medium Density | Total Price/Acre | Total Land Size (Acre) |
| 2019 | 0 | 0 | 0 | 0 | 0 | 0 |
| Qtr1 | 0 | 0 | 0 | 0 | 0 | 0 |
| Qtr2 | 0 | 0 | 0 | 0 | 0 | 0 |
| Qtr3 | 0 | 0 | 0 | 0 | 0 | 0 |
| Qtr4 | 0 | 0 | 0 | 0 | 0 | 0 |
| 2020 | 0 | 0 | 0 | 0 | 0 | 0 |
| Qtr1 | 0 | 0 | 0 | 0 | 0 | 0 |
| Qtr2 | 0 | 0 | 0 | 0 | 0 | 0 |
| Qtr3 | 0 | 0 | 0 | 0 | 0 | 0 |
| Qtr4 | 0 | 0 | 0 | 0 | 0 | 0 |
| 2021 | 0 | 0 | 0 | 0 | 0 | 0 |
| Qtr1 | 0 | 0 | 0 | 0 | 0 | 0 |
| Qtr2 | 0 | 0 | 0 | 0 | 0 | 0 |
| Qtr3 | 0 | 0 | 0 | 0 | 0 | 0 |
| Qtr4 | 0 | 0 | 0 | 0 | 0 | 0 |
| 2022 | 0 | 0 | 0 | 0 | 0 | 0 |
| Qtr1 | 0 | 0 | 0 | 0 | 0 | 0 |
| Qtr2 | 0 | 0 | 0 | 0 | 0 | 0 |
| Qtr3 | 0 | 0 | 0 | 0 | 0 | 0 |
| Qtr4 | 0 | 0 | 0 | 0 | 0 | 0 |
| 2023 | 0 | 0 | 0 | 0 | 0 | 0 |
| Qtr1 | 0 | 0 | 0 | 0 | 0 | 0 |
| Qtr2 | 0 | 0 | 0 | 0 | 0 | 0 |
| Qtr3 | 0 | 0 | 0 | 0 | 0 | 0 |
| Grand Total | 0 | 0 | 0 | 0 | 0 | 0 |